
Trevor Mahoney for The General
Estimated reading time: 6 minutes
As the U.S. accelerates towards a future of innovative transportation, not all states are keeping up. The rate of electric vehicle adoption across the country is more varied than many realize and is often shaped on a state-by-state basis by state policies, ability to deploy infrastructure, and economic or demographic factors. With some states surging ahead and others lagging behind, its crucial to map and analyze the differences to understand how to close the gaps.
Using data from the Department of Energy, state transportation agencies, and the third quarterly electric vehicle report by the Alliance for Automotive Innovation, The General has put together a guide to help you navigate these trends.
The leaders: Top states driving EV adoption
As outlined within the Alliance for Automotive Innovation Q3-2024 electric vehicle report, some states are already recording remarkably high electric vehicle shares among their new auto sales. Other states are going even further, boasting significant electric vehicle fleets compared to their population.
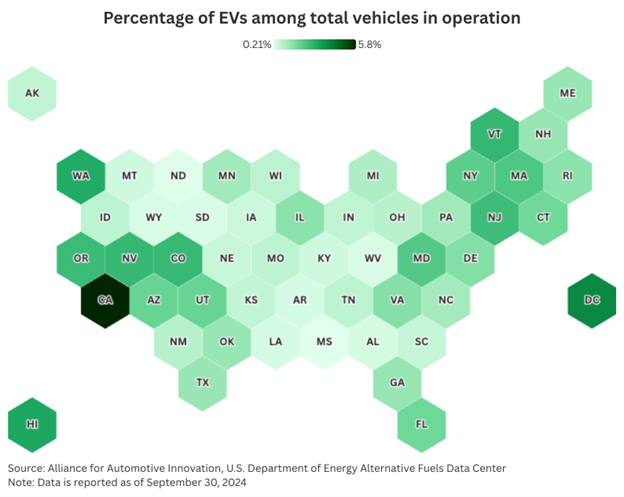
Many West Coast and Northeastern states are leading the charge. However, the data also shows an interesting statistic: The highest state has only 5.8% adoption of electric vehicles in operation. This goes to show that despite the rapid evolution of technology, its adoption is still in its infancy.
California: The undisputed champion
California is the undisputed champion of electric vehicle adoption across the United States, holding the aforementioned 5.8% total electric vehicles among those in operation. This value amounts to over 1.8 million vehicles. Part of this is due to the fact that, as outlined in the report, the Clean Air Act allows California to set stricter emissions standards. This has incidentally led to accelerated growth of the market, in addition to the states long history of electric vehicle incentives and dense urban markets.
Washington: High per-capita performance
Washington also ranks as a top performer in the country, with 3.1%, or over 219,000, of their total vehicle fleet being made up of electric vehicles. While they are ranked fourth on a percentage basis, they are second only to California on a number basis. They are also one of the six states that adopted the ACC II ZEV mandate that goes into effect with the 2026 model year, which effectively prohibits the sale of new gas-powered vehicles.
Vermont: Small state, big impact
Vermont is special, not because it rivals California and Washington in terms of the number of electric vehicles in operation, but because of its market penetration. As outlined by Visual Capitalist data from the end of FY23, Vermont had one of the highest electric vehicle registration rates per 100,000 residents at roughly 1,100.
Falling behind: States struggling with EV adoption
While some states are surging ahead, others are still facing issues. There are more reasons than one for why a state may be lagging behind, but below are some of the key trends:
Mississippi: Lowest adoption in America
At 0.21% based on the Alliance for Automotive Innovation data, Mississippi has the lowest adoption rate in the country. It also has one of the lowest rates of electric vehicles per charger across the country at a meager 14, ranking it near the bottom for electric vehicle adoption in more ways than one.
Rural state challenges
One key challenge for electric vehicle adoption lies in the demographics of certain states. Small, dispersed, or lower-income states can sometimes face additional issues. Take the following three states, for instance:
- North Dakota: North Dakota is the 48th most populated state and has a population density of only 11 people per square mile. Building out a charging infrastructure is expensive and doing it for such a low population density can only exacerbate the issue.
- Wyoming: Wyoming faces the same issue as North Dakota, with an even lower population and population density based on the same World Population Review Report. With few electric vehicles and limited grid connectivity given the space between people, adoption lags.
- Arkansas: Unlike North Dakota and Wyoming, Arkansas has a larger population. However, the appetite for electric vehicles in the state has been cited as being low, particularly due to the rural nature and distance between potential charging sites.
Key factors driving the divide
There are some common barriers to entry for the electric vehicle market. Its worth taking a deeper dive into three of the most prominent:
State policies and incentives
The states leading the charge are those that are pairing strong incentives with regulatory mandates. Six states adopted the mandate limiting gas-powered sales starting in 2026. Based on the same data source, an additional six signed up to start in the 2027 model year.
Beyond this, state policy extends further. California has 48% more electric vehicle chargers than gas nozzles now, demonstrating the investment in the technology. Other states more towards the bottom of the list simply aren’t matching this investment.
Charging infrastructure distribution
The Alliance for Automotive Innovation report also tells an interesting story regarding electric vehicles per public charger across the U.S. Buyers won’t commit to an electric vehicle without realistic access to a charging port, and the difference in charging density across the country is vast.
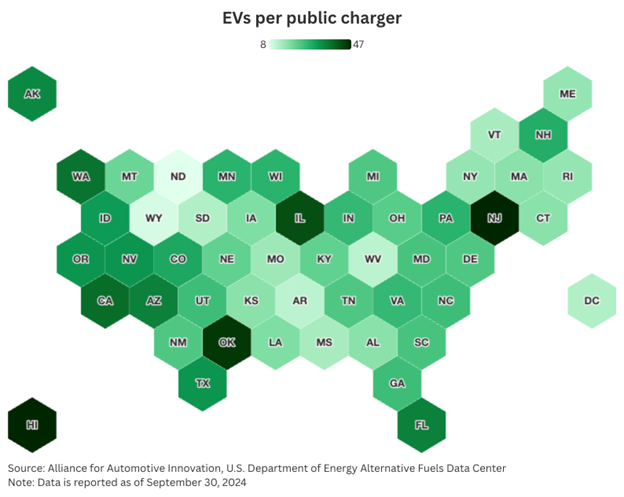
New Jersey, Illinois, Oklahoma and Hawaii rank at the bottom of electric vehicles per public charger. States that have a higher electric vehicle to port ratio face a greater potential strain and wait time at those sites, de-incentivizing purchasing such a vehicle.
Demographic and economic influences
Beyond state policy and infrastructure, there also could be socioeconomic conditions at play. The average transaction price for an electric vehicle sale in August 2025 was nearly $60,000, based on Kelley Blue Book data, which is no small sum. For states with smaller populations and less developed economies, the average salary range may put this price point far out of reach for the time being.
Looking Ahead: Future trends and implications
Continued investment into programs such as the National Electric Vehicle Infrastructure plan outlined by the Department of Energy will be crucial to the future of the market. Another factor that will inevitably shape the market will be the cost of technology utilized in the construction of electric vehicles, as a reduction could bring the entry price point down far enough for more state populations to partake. Overall, though, it will take widespread state policy changes to ensure there is a reliable electricity supply and smart charging available to service electric vehicle fleets as they develop.
Bridging the electric vehicle divide in America
Electric vehicle adoption in the United States certainly isn’t uniform. While states like California, Washington, and Vermont are leading the charge, others are lagging behind due to socioeconomic and political factors. These reasons aren’t mysterious, and the right mix of policy changes and investments in infrastructure can make a significant dent. As the nation continues to adopt cleaner transportation, ensuring no state is left behind will be critical to the development of a nationwide electric vehicle infrastructure.
This story was produced by The General and reviewed and distributed by Stacker.